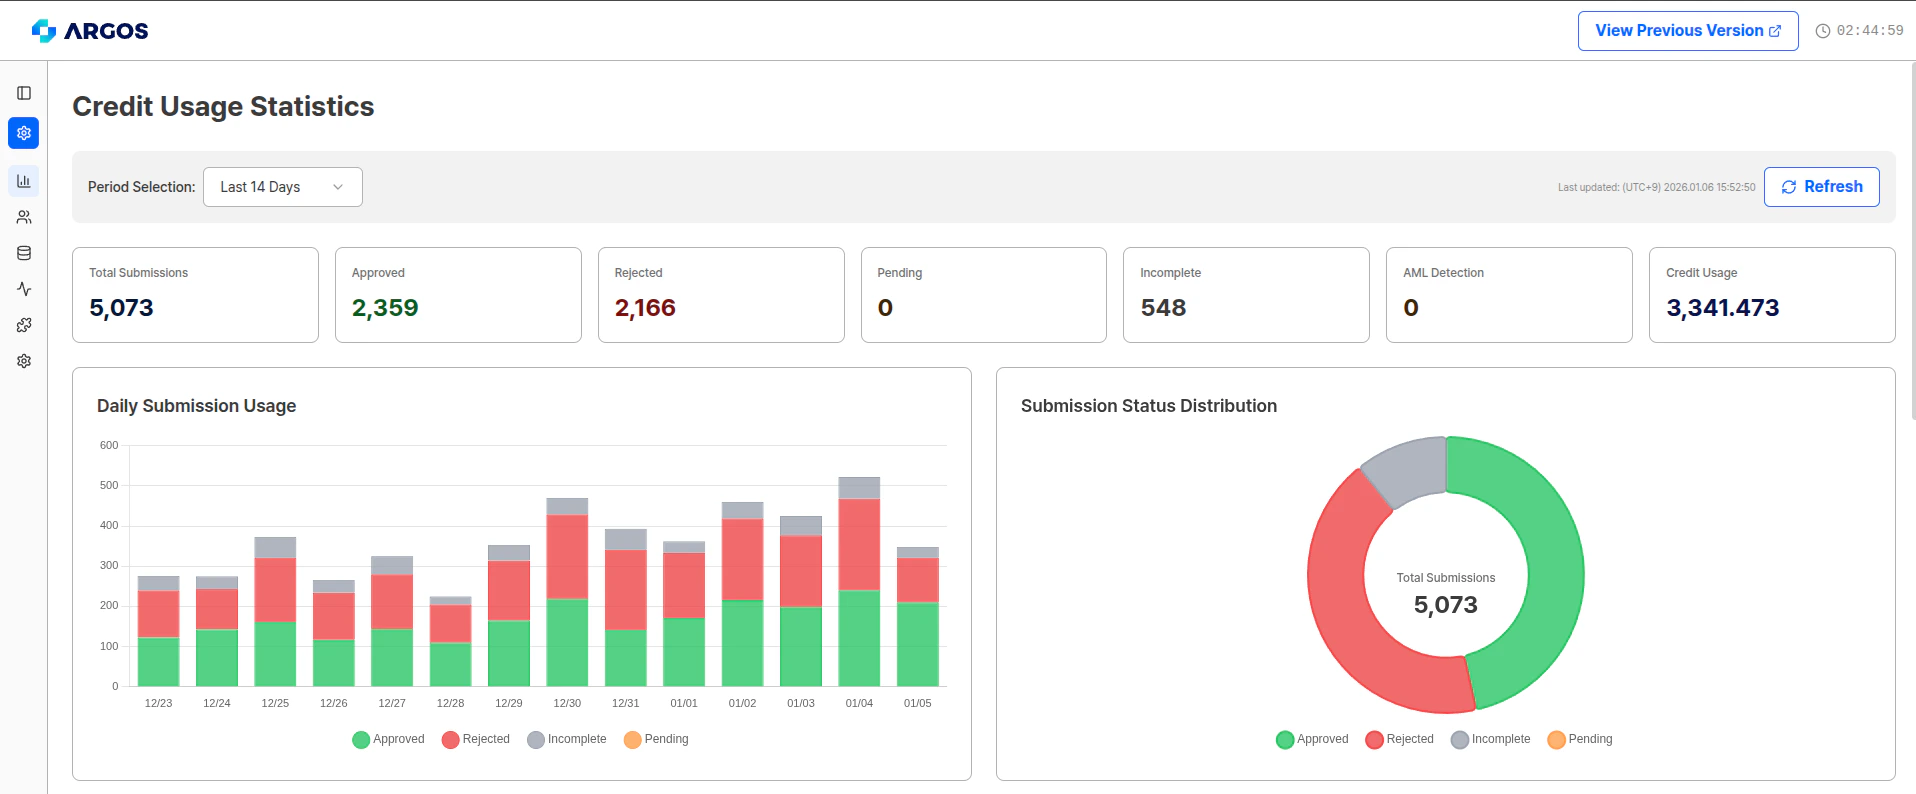
Key Statistics Indicators
You can view the overall service usage at a glance at the top of the page:| Indicator | Description |
|---|---|
| Total Count | Total number of submissions |
| Approved | Number of approved submissions |
| Rejected | Number of rejected submissions |
| Incomplete | Number of incomplete submissions |
| Pending | Number of submissions pending review |
| AML Count | Number of AML-related submissions |
| Credit Usage | Total credits used |
Submission Status Descriptions
Approved
Approved
The status when a user’s submission has been approved through the ID check service. All authentication procedures including ID and selfie have been completed normally.
Pending
Pending
After the AI system performs a primary review based on the final submitted information, this status indicates that approval or rejection processing is required by the project administrator or relevant personnel.
Incomplete
Incomplete
This status indicates that the user (submitter) left the page during the eKYC process or did not complete the final submission of required documents and information.
Rejected
Rejected
This status indicates that the system has determined the submission to be unsuitable, or that an administrator or relevant personnel has rejected it from a pending state.
Visualization Charts
The Statistics page provides the following visual elements:Daily Submission Volume
View daily submission volume and status distribution through bar charts.
Submission Status Distribution
Display the ratio of each status in a pie chart for all submissions.
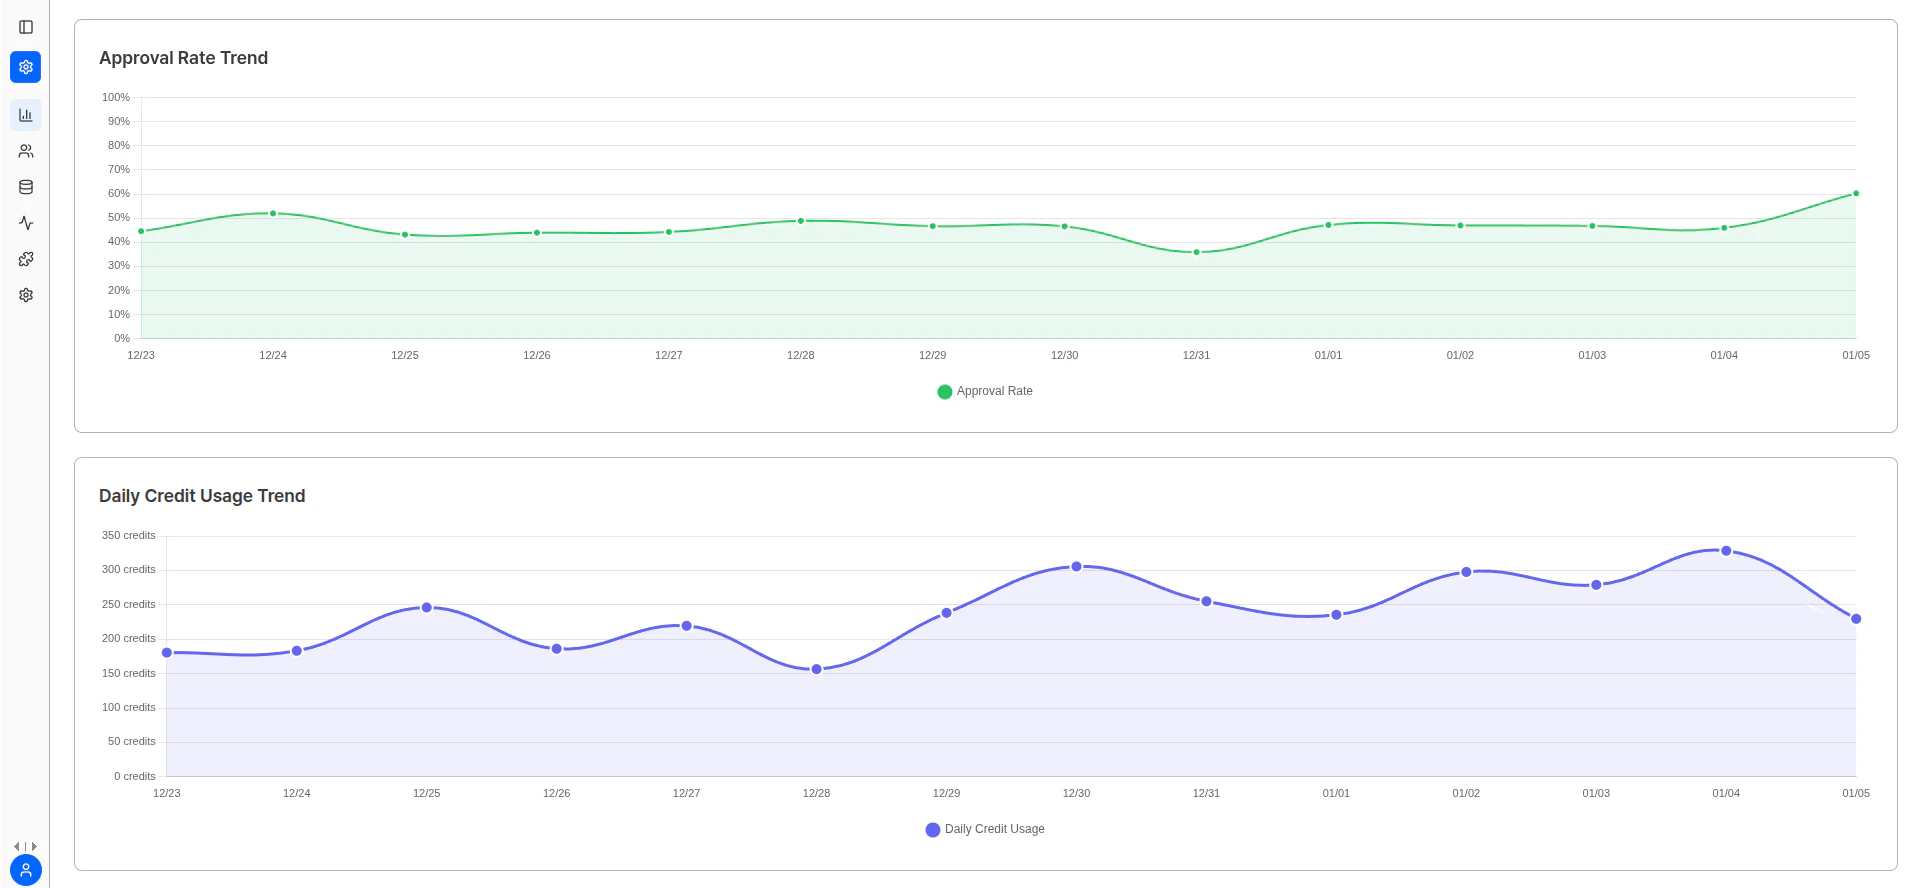
Daily Approval Rate Trend
Monitor approval rate changes over time with a line graph.
Daily Credit Usage
Monitor credit usage changes over time with a line graph.
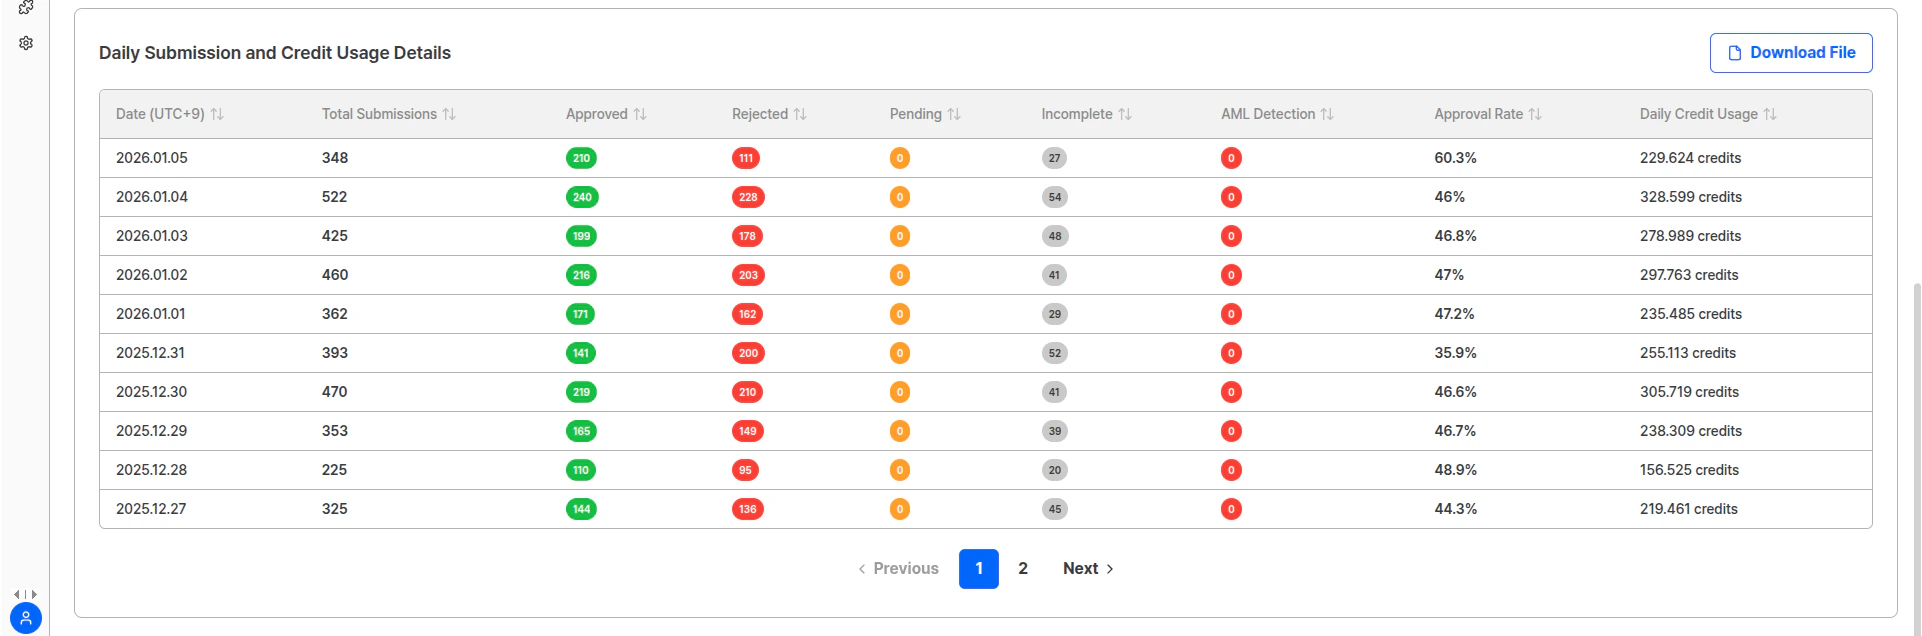
Detailed Data Table
You can view daily detailed statistics in the bottom table:- Total submission count by date
- Count and ratio by status
- Daily approval rate
- Daily credit usage
Filter and Query Functions
You can query data with various conditions using the filter functions at the top:- Query data by specific period
- Filter by submission status
- Set custom date range
- Sort by credit usage
How to Use
You can efficiently perform the following tasks through the Statistics page:Related Documentation
User Submissions
View and manage detailed information for individual submissions.
Event Log
Track event history for each submission.
Query Data via API
Learn how to query large amounts of data via API.
Webhook Settings
Set up webhooks for real-time notifications.